


Introduction to Algorithmic Execution - Part 5: Volume Weighted Average Price (VWAP)
Published by: OrderX
•

Pacing an order along the market's intraday volume curve: profile estimation, adaptive pacing, and when VWAP beats TWAP.
The Volume-Weighted Average Price (VWAP) algorithm keeps the scheduled skeleton of TWAP but replaces its flat, clock-driven pace with one proportional to how volume typically arrives during the day. It trades more when the market usually trades more, less when it is usually quiet - that single change makes VWAP the most widely used benchmark algorithm.

The Volume Profile
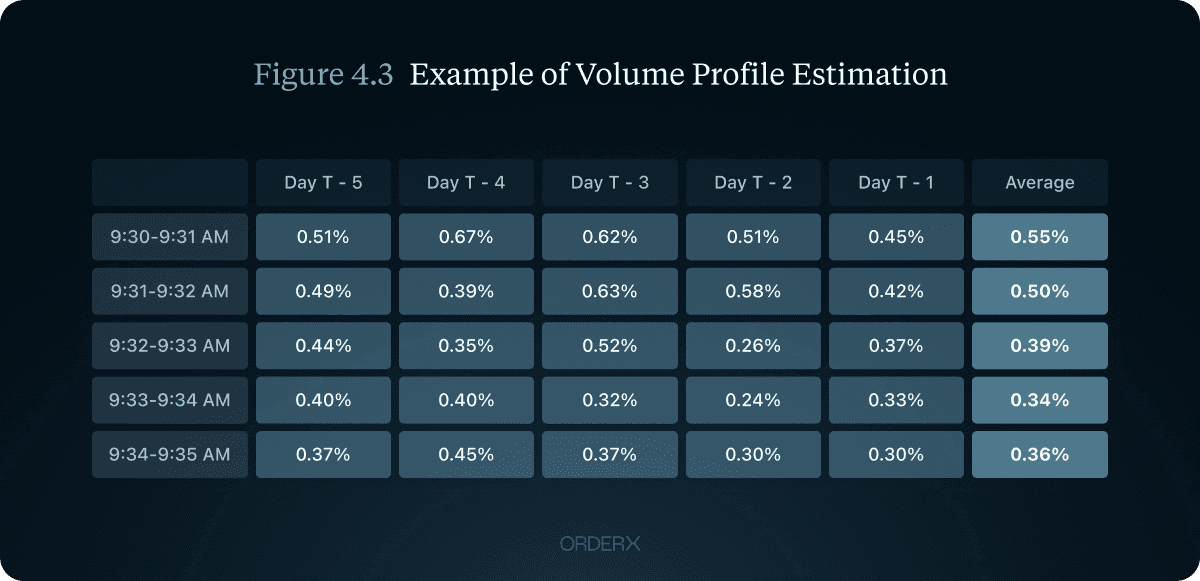
Equity volume is famously U-shaped: heavy at the open, quiet through midday, heavy again into the close. A VWAP engine encodes this as a volume profile - the fraction of a typical day’s volume expected in each time bin - and paces the order along it. Sessions with unusual dynamics (index rebalances, option expiries, earnings days) get their own profiles, because their volume curves look nothing like an ordinary day.
Operationally the algorithm is simple:
Extract the slice of the profile between the order’s start and end times.
Renormalize that slice to 100% - it becomes the order’s target schedule.
Wrap it in bands - the same upper/lower boundary machinery as TWAP polices deviation from the curve.
In fact, most codebases implement TWAP as a special case of VWAP with a perfectly flat profile.
A Worked Example
Say you must buy 80,000 units between 15:30 and 15:45, and the historical profile assigns those three 5-minute bins 3%, 4%, and 5% of daily volume - 12% in total. Renormalizing gives bin targets of 25%, 33.3%, and 41.7%: schedule 20,000 units for the first bin, roughly 26,700 for the second, and 33,300 for the last. A TWAP over the same window would do a flat 26,667 per bin - over-trading the thin first bin and under-trading the liquid final one. VWAP concentrates its demands where liquidity is expected to be densest, which is precisely how it hides.
Relative, Not Absolute, Volume
The profile is about the volume’s shape, not its level. The order must complete over the horizon whether the day trades light or heavy, so if all bins double, the schedule doesn’t change at all - the curve’s shape is identical. The profile only misleads when the shape shifts, which is why special-day handling matters more than day-to-day volume noise. Reacting to realized volume levels is a different strategy altogether - that is POV, Part 6.
Building Better Profiles
Since the profile is the strategy, profile estimation deserves real effort. Four approaches, in increasing sophistication:
Per-asset averaging: average each bin’s volume share over weeks or months of history. Captures name-specific quirks but needs enough sample to wash out noise.
Cohort profiles: for illiquid assets whose individual histories are too jagged, group similar instruments (by liquidity tier, listing venue, sector) and share a smoothed cohort curve.
Regime clustering: cluster historical days (trend days, mean-reversion days, high-volatility days) with k-means or similar, classify today in real time, and apply the matching profile.
Special-day libraries: maintain dedicated curves for earnings, rebalances, macro releases (CPI, FOMC), and expiries, where the ordinary profile is simply wrong.
Beyond the Static Curve
Production VWAPs, including OrderX’s implementation, add adaptive layers on top of the historical schedule:
Realized-volume pacing: if the tape is running hotter than the profile predicted, scale the schedule up in real time; throttle back on a dead tape.
Price tilting: lean into favorable prices - accelerate modestly when the market moves your way, ease off when it runs away - while staying inside the bands.
Volatility-aware bands: widen tolerance in fast markets to avoid paying panicked spreads; tighten it when conditions are calm.
Size and band randomization: the same camouflage as TWAP - no repeating clip sizes, no tell-tale linear ramps.
Opportunistic bursts and hard limits: abandon the curve briefly to capture a dislocation; pause entirely beyond a protective price.
Strengths and Weaknesses
Strengths. VWAP inherits all of TWAP’s impact-spreading benefits and adds concealment: because its footprint mirrors natural market activity, it is genuinely harder to detect. It measures cleanly - beat the day’s VWAP print and the execution defends itself (see Part 12 for the caveats). And volume-weighting inherently downplays noisy low-volume price prints.
Weaknesses. It leans entirely on history - when today’s volume pattern breaks from precedent, the schedule is wrong. In illiquid names the profile is statistical noise, and a single block print can distort both the schedule and the benchmark. It carries no urgency: a strict VWAP will patiently underperform through an adverse trend rather than finish early. And its very popularity makes the crowd predictable - a stampede of VWAP algorithms all leaning on the same U-curve is itself a pattern others exploit.

Choosing Between TWAP and VWAP
The practical rule: use VWAP in liquid instruments with stable, well-estimated intraday patterns; use TWAP where no trustworthy profile exists - new listings, thin altcoins, unusual sessions. Both are schedule-followers at heart. When you want the pace to react to what the market is actually doing rather than what it usually does, you want Percent of Volume - Part 6.

A new way to
trade is here.
OrderX equips serious traders with the tools they’ve been waiting for Structured execution, integrated systems, and built-in intelligence.